Infrastructure protection2012 sees slowdown in the increase in global CO2 emissions
Actual global emissions of carbon dioxide (CO2) reached a new record of 34.5 billion tons in 2012. Yet, the increase in global CO2 emissions in that year slowed down to 1.1 percent, which was less than half the average annual increase of 2.9 percent over the last decade. This is remarkable, as the global economy grew by 3.5 percent. This development signals a shift toward less fossil-fuel-intensive activities, more use of renewable energy, and increased energy saving. Increases in fossil-fuel consumption in 2012 were 2.2 percent for natural gas, 0.9 percent for oil products, and 0.6 percent for coal.
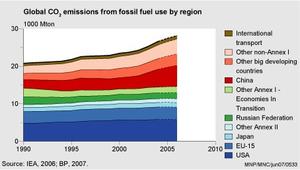
Chart of CO2 emissions for the major regions of the world // Source: wikipedia.org
Actual global emissions of carbon dioxide (CO2) reached a new record of 34.5 billion tons in 2012. Yet, the increase in global CO2 emissions in that year slowed down to 1.1 percent, which was less than half the average annual increase of 2.9 percent over the last decade. This is remarkable, as the global economy grew by 3.5 percent. This development signals a shift toward less fossil-fuel-intensive activities, more use of renewable energy, and increased energy saving. Increases in fossil-fuel consumption in 2012 were 2.2 percent for natural gas, 0.9 percent for oil products, and 0.6 percent for coal.
The share of the “new” renewable energy sources solar, wind, and biofuel increased at an accelerating speed: from 1992 it took fifteen years for the share to double from 0.5 percent to 1.1 percent, but only six more years to do so again, to 2.4 percent by 2012.
A PBL Netherlands Environmental Assessment Agency release reports that these are some of the main findings in the annual report Trends in global CO2 emissions, released today by PBL Netherlands Environmental Assessment Agency and the European Commission’s Joint Research Center (JRC). The report is based on recent results from the Emissions Database for Global Atmospheric Research (EDGAR) and the latest statistics on energy use and various other activities.
China, U.S. and EU remain top emitting countries
Three countries/regions remain responsible for 55 percent of total global CO2 emissions. Of these three, China (29 percent share) increased its CO2 emissions by 3 percent, which is low compared with annual increases of about 10 percent over the last decade. Although China’s CO2 emissions per capita are comparable to those in the EU and almost half of the U.S. emissions per capita, its CO2 emissions per USD in Gross Domestic Product (GDP) are almost double those in the EU and the United States and similar to those in the Russian Federation. In the United States (16 percent share), CO2 emissions decreased by 4 percent, mainly because of a further shift from coal to gas in the power sector. The European Union (11 percent share) saw its emissions decrease by 1.6 percent, mainly due to a decrease in energy consumption (oil and gas) and a decrease in road freight transport.
A more permanent slowdown?
The small increase in emissions of 1.1 percent in 2012 (including a downward correction of 0.3 percent for it being a leap year), may be the first sign of a more permanent slowdown in the increase in global CO2 emissions, and ultimately of declining global emissions, if (a) China achieves its own target for a maximum level of energy consumption by 2015 and its shift to gas with a natural gas share of 10 percent by 2020; (b) the United States continues a shift in its energy mix towards more gas and renewable energy; and (c) in the European Union, member states agree on restoring the effectiveness of the EU Emissions Trading System to further reduce actual emissions.
— Read more in Trends in Global CO2 Emissions: 2013 Report (PBL, Netherlands Environmental Assessment Agency, 2013); this PBL interactive presentation; for the complete data behind the report see this Excel document; and the Web site of the Emissions Database for Global Atmospheric Research (EDGAR)