DisastersHurricane Sandy caused dramatic changes to hundreds of miles of East Coast shoreline
The United States Geological Survey (USGS) has released a series of aerial photographs showing before-and-after images of Hurricane Sandy’s impacts on the Atlantic Coast; the photos, part of a USGS assessment of coastal change from as far south as the Outer Banks of North Carolina to as far north as Massachusetts, show that the storm caused dramatic changes to portions of shoreline extending hundreds of miles
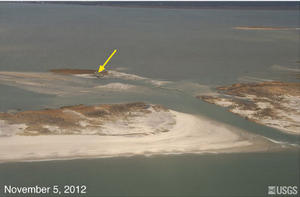
A new inlet through New York's Fire Island cut by Sandy // Source: usgs.gov
The United States Geological Survey (USGS) has released a series of aerial photographs showing before-and-after images of Hurricane Sandy’s impacts on the Atlantic Coast.
The photos, part of a USGS assessment of coastal change from as far south as the Outer Banks of North Carolina to as far north as Massachusetts, show that the storm caused dramatic changes to portions of shoreline extending hundreds of miles. A USGS release reports that pre- and post-storm images of the New Jersey and New York shoreline in particular tell a story of a coastal landscape that was considerably altered by the historic storm.
“Sandy taught us yet again that not all Cat-1 hurricanes are created equal: the superstorm’s enormous fetch over the Atlantic produced storm surge and wave erosion of historic proportions,” said USGS director Marcia McNutt. “We have seized this opportunity to gather unique data on a major coastline-altering event.”
As major storms approach, the USGS conducts pre-storm and post-storm flights to gather aerial images along the length of the coastline expected to experience impacts from the storm’s landfall. Identifying sites of such impacts helps scientists understand which areas are likely to undergo the most severe impacts from future storms, and improves future coastal impact forecasting.
Photo pairs from North Carolina to Massachusetts will be made available online as the coastal change assessment continues.
“This storm’s impact on sandy beaches included significant beach and dune erosion and minor disruption of infrastructure in the south,” said USGS oceanographer Nathaniel Plant, “to extreme and often catastrophic erosion, overwash and sediment deposition, and inundation on northern beaches like Mantoloking, New Jersey.”
Overwash occurs when storm surge and waves exceed the elevation of protective sand dunes, thereby transporting sand inland. In addition to threatening infrastructure like roadways, it can bury portions of buildings and cause extensive property damage. Since beaches and dunes serve as a first line of defense against extreme storms, this could further compromise the safety of coastal populations.
Data collected from these surveys are also used to improve predictive models of potential impacts from future severe storms. Before a storm makes landfall, USGS makes these predictions to help coastal communities identify areas particularly vulnerable to severe coastal change, such as beach and dune erosion, overwash, and inundation.
For instance, in the days before Sandy approached the eastern seaboard, the USGS ran models forecasting that 91 percent of the Delmarva coastline would experience beach and dune erosion, while 98 percent and 93 percent of beaches and dunes in New Jersey and New York, respectively, were likely to erode. Preliminary analysis suggests that Hurricane Sandy rapidly displaced massive quantities of sand in a capacity that visibly changed the landscape.
The USGS says it worked closely with the National Park Service to gather field data on pre- and post-storm conditions at Fire Island National Seashore on Long Island. The field team went to Fire Island in advance of the storm to capture the morphology of the beach and dunes. The team re-surveyed the beach to capture its state immediately after the storm, and they found drastic changes.
“We found that there was widespread dune erosion and overwash,” said St. Petersburg-based USGS coastal geologist Cheryl Hapke. “On average the dunes eroded back 70 feet - the equivalent of 30-years of change, which had previously been measured. Our data also showed that dunes lost as much as 10 feet of elevation.”
This rapid response data was used to help the National Park Service assess the areas of the coast that were most vulnerable to a nor’easter that impacted the coast a week after Sandy.
The USGS is also processing pre- and post-landfall airborne lidar data to gather information on the extent of coastal change caused by Sandy. Lidar, or light detection and ranging, is an aircraft-based remote sensing method that uses laser pulses to collect highly detailed ground elevation data.