DisastersExplaining 2011 extreme weather events
2011 will be remembered as a year of extreme weather events, both in the United States and around the world; NOAA says that every weather event that happens now takes place in the context of a changing global environment; a comprehensive annual report – State of the Climate in 2011 — provides scientists and citizens with an analysis of what has happened so organizations and individuals can prepare for what is to come
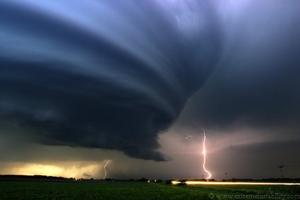
NOAA says extreme weather due to changing global environment // Source: smog.pl
Worldwide, 2011 was the coolest year on record since 2008, yet temperatures remained above the 30 year average, according to the State of the Climate in 2011 report released online yesterday by the National Oceanic and Atmospheric Administration (NOAA). The peer-reviewed report, issued in coordination with the American Meteorological Society (AMS), was compiled by 378 scientists from forty countries around the world. It provides a detailed update on global climate indicators, notable weather events and other data collected by environmental monitoring stations and instruments on land, sea, ice and sky.
“2011 will be remembered as a year of extreme events, both in the United States and around the world,” said Deputy NOAA Administrator Kathryn Sullivan. “Every weather event that happens now takes place in the context of a changing global environment. This annual report provides scientists and citizens alike with an analysis of what has happened so we can all prepare for what is to come.”
NOAA says that two back-to-back La Niñas, each characterized by cooler-than-average water temperatures in the eastern equatorial Pacific, affected regional climates and influenced many of the world’s significant weather events throughout the year. These included historic droughts in East Africa, the southern United States and northern Mexico. La Niña conditions contributed to an above-average tropical cyclone season in the North Atlantic hurricane basin and a below-average season in the Eastern North Pacific. It was also associated with the wettest two-year period (2010–11) on record in Australia, which was particularly remarkable as the wet conditions followed a decade-long dry spell.
The Arctic continued to show more rapid changes than the rest of the planet. Sea ice shrank to its second smallest “summer minimum” extent on record during 2011, as older ice (four to five years old) reached a new record minimum at more than 80 percent below average. Overall, glaciers around the world continued to lose mass. Loss from Canadian Arctic glaciers and ice caps were the greatest since measurements began in 2002.
The report used forty-three climate indicators to track and identify changes and overall trends to the global climate system. These indicators include greenhouse gas concentrations, temperature of the lower and upper atmosphere, cloud cover, sea surface temperature, sea level rise, ocean salinity, sea ice extent and snow cover. Each indicator includes thousands of measurements from multiple independent datasets.