-
Calculating monetary losses from floods caused by sea level rise
Damages from extreme events like floods are even more relevant than the mean sea level itself when it comes to the costs of climate impacts for coastal regions. However, while it is now rather well understood how sea-levels will rise in the future, only small progress has been made estimating how the implied damage for cities at the coasts will increase during the next decades. Scientists now provide a method to quantify monetary losses from coastal floods under sea-level rise. For the first time, the scientists show that the damage costs consistently increase at a higher rate than the sea-level rise itself.
-
-
New heat-wave formula to help health agencies prepare for extreme temperatures
Extreme heat can pose several health risks, such as dehydration, hyperthermia, and even death, especially during sustained periods of high temperatures. However, a uniform definition of a heat wave does not exist. As a result, public health agencies may be unsure of when to activate heat alerts, cooling centers and other protective measures. Researcher has developed a uniform definition of a heat wave that may help public health agencies prepare for extreme temperatures.
-
-
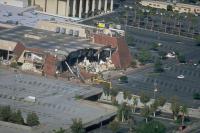
Science-based data collection key to better wildland fire defense
In February 2011, three fires raged through suburban areas outside of Amarillo, Texas, at the wildland urban interface (WUI), the area where residential communities and undeveloped wildlands meet. A new report by the National Institute of Standards and Technology (NIST) describes how researchers analyzed a major 2011 Texas wildland fire using a rigorous and scientifically based post-fire data collection approach, a system they believe will lead to improved defensive measures and strategies for significantly reducing structural damage and property loss.
-
-
Sea-level rise in twentieth century faster than in any previous century
Global sea level rose faster in the twentieth century than in any of the twenty-seven previous centuries, according to a new study. Moreover, without global warming, global sea level would have risen by less than half the observed twentieth century increase and might even have fallen. Instead, global sea level rose by about 14 centimeters, or 5.5 inches, from 1900 to 2000. This is a substantial increase, especially for vulnerable, low-lying coastal areas.
-
-
New tool for coastal planners preparing for sea level rise
Scientists have developed a new model to help coastal planners assess the risks of sea level rise. Put to use on a global scale, it estimates that the oceans will rise at least twenty-eight centimeters on average by the end of this century — and as much as 131 cm if greenhouse gas emissions continue to grow unchecked.
-
-
Experts tackle U.K. flood risk
The U.K. Blue-Green Cities Research Project combines the expertise of academics from nine U.K. universities plus partners in the United States and China specializing in flood inundation modelling, computation fluid dynamics, sediment debris processes, river restoration and habitats, urban drainage infrastructure, environmental economics, uncertainty, flood risk management, and stakeholder engagement. The project’s goal is to make U.K. cities more resilient to flooding.
-
-
Protecting the grid from weather geomagnetic storms
On 9 March 1989, a huge cloud of solar material exploded from the sun, twisting toward Earth. When this cloud of magnetized solar material — called a coronal mass ejection, or CME — reached our planet, it set off a chain of events in near-Earth space that ultimately knocked out power to the Canadian province Quebec for about nine hours. Though CMEs hit Earth often, those with the potential to shut down an entire power grid are rare — and scientists want to make sure that next time, we are prepared. Because space weather can have — at its very worst — such significant consequences, scientists from NASA are creating models to simulate how space weather can impact our power grid.
-
-
GPS allows for better, faster tsunami warnings
Existing GPS instruments at monitoring stations worldwide could be used to increase the speed and accuracy of tsunami warnings, according to a new study. Real-time Global Positioning System (GPS) measurements can be used to show how major earthquakes displace the ocean floor, cutting tsunami warning times by nearly twenty minutes and potentially reducing harm to coastal communities, according to researchers.
-
-
Smartphones app creates worldwide seismic network

UC Berkeley scientists last week released a free Android app that taps a smartphone’s ability to record ground shaking from an earthquake, with the goal of creating a worldwide seismic detection network that could eventually warn users of impending jolts from nearby quakes. The app, called MyShake, is available from the Google Play Store and runs in the background with little power, so that a phone’s onboard accelerometers can record local shaking any time of the day or night.
-
-
Extreme weather likely to result in “food shocks”
A panel of British and American researchers, speaking at the annual meeting of the American Association for the Advancement of Science (AAAS) in Washington, D.C., presented updated research revealing how extreme events which affect the food system are increasingly likely to occur, resulting in “food shocks.”
-
-
Better Greenland, Antarctica sheet modeling helps predict sea-level rise
The Greenland and Antarctic ice sheets will make a dominant contribution to twenty-first century sea-level rise if current climate trends continue. However, predicting the expected loss of ice sheet mass is difficult due to the complexity of modeling ice sheet behavior. Better to understand this loss, a team of Sandia National Laboratories researchers has been improving the reliability and efficiency of computational models that describe ice sheet behavior and dynamics.
-
-
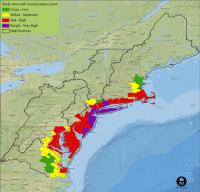
The number of 2015 earthquake around the world – 14,588 -- on par with previous years
Globally there were 14,588 earthquakes of magnitude 4.0 or greater in 2015. This worldwide number is on par with prior year averages of about forty earthquakes per day of magnitude 4.0, or about 14,500 annually. The 2015 number may change slightly as the final results are completed by seismic analysts. In 2015, there were 19 earthquakes worldwide with a magnitude of 7.0 or higher. Since about 1900, the average has been about 18 earthquakes per year. More than 143 million residents living in the 48 contiguous states may potentially be exposed to damaging ground shaking from earthquakes.
-
-
Levees may make flood risk higher, not lower
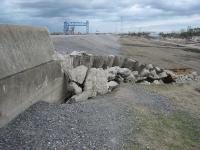
People living behind levees on floodplains may not be as immune to flood damage as they think, according to results of a new study. U.S. floodplains are lined by more than 100,000 miles of levees, many of which are in questionable states of repair.
-
-
Bad news for L.A.: Earthquake ruptures can jump much farther than previously thought
A team of researchers Riverside, has discovered that earthquake ruptures can jump much farther than previously thought, a finding that could have severe implications on the Los Angeles area and other regions in the world. The scientists found that an earthquake that initiates on one thrust fault can spread ten times farther than previously thought to a second nearby thrust fault, vastly expanding the possible range of “earthquake doublets,” or double earthquakes.
-
-
Record Missouri flooding was man-made calamity: Scientists
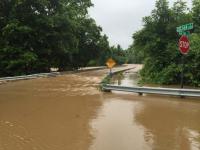
At the end of December 2015, a huge storm named “Goliath” dumped 9-10 inches of rain in a belt across the central United States, centered just southwest of St. Louis, most of it in a three-day downpour. The rain blanketed the Meramec Basin, an area of 4,000 square miles drained by the Meramec River, which enters the Mississippi River south of St. Louis. Why was the flooding so bad? Most news reports blamed it on the heavy rain, but researcher say there was more to the flood than the rain.
-
The long view
Using Drone Swarms to Fight Forest Fires
Forest fires are becoming increasingly catastrophic across the world, accelerated by climate change. Researchers are using multiple swarms of drones to tackle natural disasters like forest fires.
How Climate Change Will Affect Conflict and U.S. Military Operations
“People talk about climate change as a threat multiplier,” said Karen Sudkamp, an associate director of the Infrastructure, Immigration, and Security Operations Program within the RAND Homeland Security Research Division. “But at what point do we need to start talking about the threat multiplier actually becoming a significant threat all its own?”